 PQL Procedures


|
| PQL Procedures | | Graph |
GRAPH SAVE FILE OBS = [ var| function(var)]  [ , ... ]
                ROW = var [ 'row title' ]
                          [ (i1 [,i2 [,i3 ]]) ]
                          [ 'value labels' 'xxxx' ... ]
              [ BOOLEAN = (log_expression) ]
              [ COL = var [ 'col title' ]
                          [ (i1 [,i2 [,i3 ]]) ]
                          [ 'value labels' 'xxxx' ... ] ]
              [ FILENAME = filename]
              [ MULTIPLE ]
              [ SAMPLE = sample ]
              [ SUBTITLE = 'subtitle' ]
              [ TITLE = 'title' ]
The GRAPH SAVE FILE procedure produces a text file suitable for input to the SIRGRAPH module. The procedure can run on any supported hardware platform but SIRGRAPH itself is Windows based.
The resulting graph can be two-dimensional, stacked two dimensional or three dimensional.
A two dimensional graph has an observation variable to control the magnitude of each graphed item and a row control variable with discrete values that determines the number of categories graphed.
A stacked two dimensional graph has multiple values in each category. These may be separate observation variables or may represent the different values from a second control variable.
A three dimensional graph has a row and a column control variable that determine the number of categories and an observation variable that controls the magnitude of each category.
OBS
|
This is required. Specifies the variable that is used to calculate totals, averages or other values that then translates into the magnitude on the graph e.g. the height of individual bars in the chart.
The default magnitude for numeric observation variables is the total or
Multiple observation variables can be specified that generate a stacked 2D graph (cannot specify a COL clause with multiple observation variables). |
ROW
|
This is required. Specifies a row control variable. The values of this variable determine the number of rows on the graph. The variable can either have discrete values specified as part of the variable definition or you can specify the values in this clause. The variable may be numeric or a short string (up to eight characters). The default row title is the variable label or variable name if there is no label. Specify a row title in quotes immediately after the variable name if required.
If the variable does not have defined specific values or you want to specify different categories, specify the values in parentheses. The individual row values have labels. By default these are taken from the value labels or categorical string values. Specify value labels on the command to label specified category values or to use instead of the defaults. Enclose each label in quotes. |
BOOLEAN
| Specifies which procedure table records are used by the procedure. The procedure table records for which the logical expression is true are used by the procedure. If this option is not specified, all procedure table records are used. |
COL
|
Specifies a column control variable. If specified, must not precede the ROW parameter. Cannot be used with multiple observation variables. The values of this variable determine the number of columns on the graph unless the MULTIPLE option is specified (see below). The variable can either have discrete values specified as part of the variable definition or you can specify the values in this clause. The variable may be numeric or a short string (up to eight characters). The default column title is the variable label or variable name if there is no label. Specify a column title in quotes immediately after the variable name if required.
If the variable does not have defined specific values or you want to specify different categories, specify the values in parentheses. The individual column values have labels. By default these are taken from the value labels or categorical string values. Specify value labels on the command to label specified category values or to use instead of the defaults. Enclose each label in quotes. |
FILENAME
|
Specify the filename
created by the procedure. If no FILENAME clause is specified, the output is written to a default file sirgraph.srg. |
MULTIPLE
|
The keyword MULTIPLE specifies that a stacked 2D graph using the column variable is produced rather than a 3D graph.
|
SAMPLE
|
Specifies that a random sample of the procedure table records are
used by the procedure. The fraction specifies the percent of records used and is specified as a positive decimal number less than or equal to 1 (one). .25, for example specifies that a 25% sample be used. |
SUBTITLE
|
Specifies the heading text on the graph footer. Enclose the text in quotes. If SUBTITLE is not
used, the subtitle is "Created by SIR/XS on DATE at TIME". |
TITLE
|
Specifies the text on the graph title. Enclose the text in quotes. If TITLE is not
used, the title is the variable label or name when no label. |
| |
EDUC).
RETRIEVAL
PROCESS CASES
. PROCESS REC EMPLOYEE
. GET VARS EDUC
. PERFORM PROCS
. END REC
END CASE
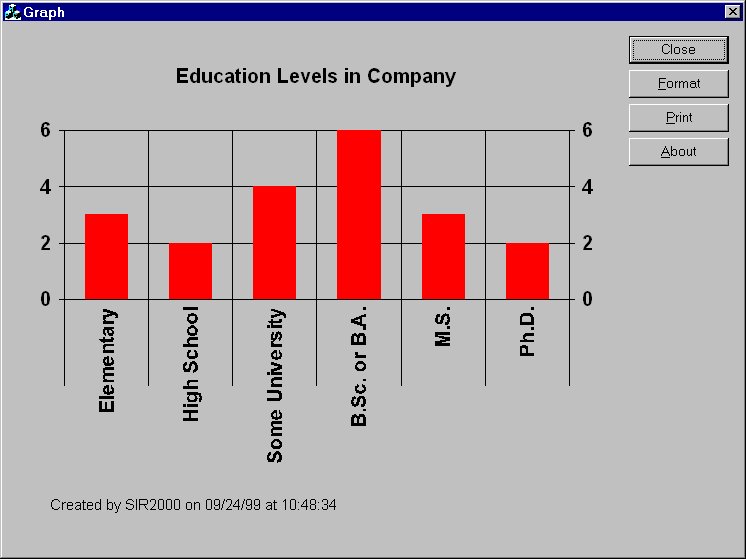
GRAPH SAVE FILE OBS = COUNT(EDUC) /
ROW = EDUC /
FILENAME = GRAPH1.SRG /
TITLE = 'Education Levels in Company'
END RETRIEVAL
On completion of the program, the file GRAPH1.SRG contains text that can be viewed with
ESCAPE 'sirgraph.exe GRAPH1.srg'which looks something like:
CURRPOS).
RETRIEVAL
PROCESS CASES
. PROCESS REC EMPLOYEE
. GET VARS SALARY CURRPOS
. PERFORM PROCS
. END REC
END CASE
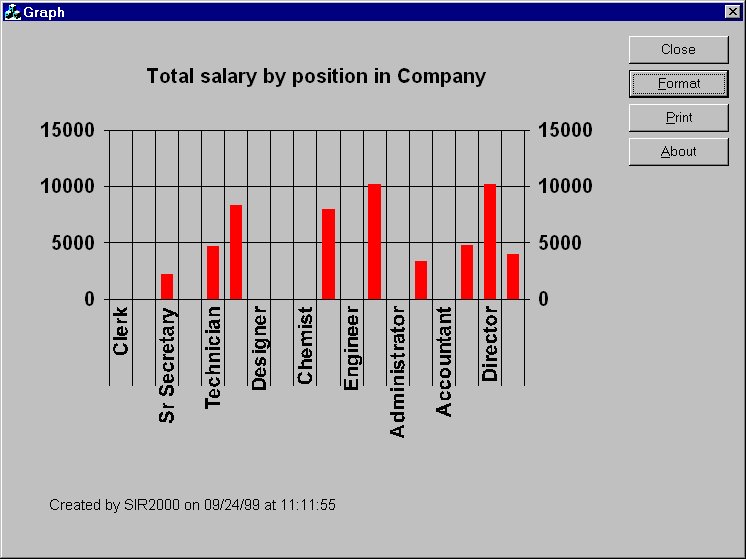
GRAPH SAVE FILE OBS = SALARY /
ROW = CURRPOS /
FILENAME = GRAPH2.SRG /
TITLE = 'Total salary by position in Company'
END RETRIEVAL
On completion of the program, the file GRAPH2.SRG contains text that can be viewed with
ESCAPE 'sirgraph.exe GRAPH2.srg'which looks something like:
RETRIEVAL
PROCESS CASES
.  PROCESS REC EMPLOYEE
.    GET VARS SALARY GENDER
.    PERFORM PROCS
.  END REC
END CASE
GRAPH SAVE FILE   OBS  = PTSUM(SALARY) /
                  ROW  = GENDER        /
            FILENAME   = GRAPH3.SRG  /
            TITLE      = 'Salary percentage by Gender'
END RETRIEVAL
On completion of the program, the file GRAPH2.SRG contains text which can be viewed with
ESCAPE 'sirgraph.exe GRAPH3.srg'You might then use some of the options in sirgraph to produce a chart something like:

RETRIEVAL
PROCESS CASES
. PROCESS REC EMPLOYEE
. GET VARS SALARY GENDER EDUC
. PERFORM PROCS
. END REC
END CASE
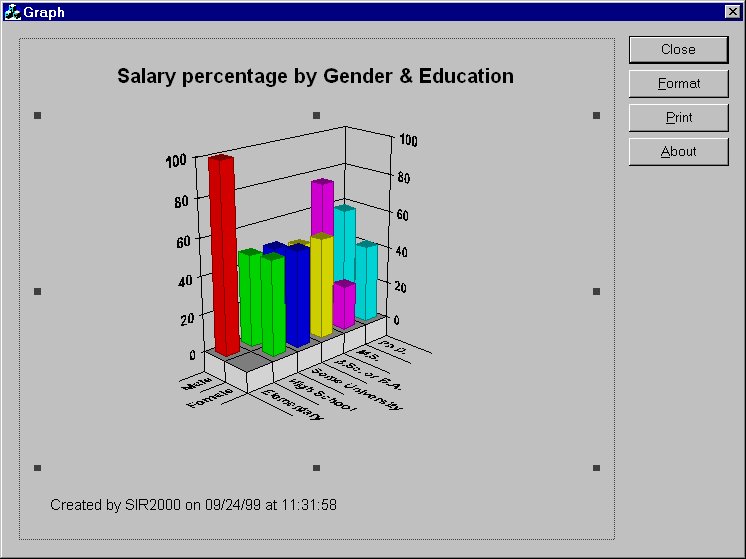
GRAPH SAVE FILE OBS = PRSUM(SALARY) /
ROW = GENDER /
COL = EDUC /
FILENAME = GRAPH4.SRG /
TITLE = 'Salary percentage by Gender & Education'
END RETRIEVAL
On completion of the program, the file GRAPH2.SRG contains text which can be viewed with
ESCAPE 'sirgraph.exe GRAPH4.srg'You might then use some of the options in sirgraph to produce a chart something like:
| |