 PQL Procedures


|
| PQL Procedures | | Plot |
PLOT procedure generates a two dimensional table containing pairs of values which are the values in those variables for each occurrence in the procedure table. This information is written to a text file together with a set of statistics calculated from the data. This file is then used by the sirgraph module to produce LINE or SCATTER plots.
The statistics are the results of a simple linear regression of the variables. The
following statistics are calculated:
The mean and standard deviation for each variable independently;
The correlation coefficient - r and r squared and the probability of significance of r;
The T-distribution and DF (which is two less than the number of observations).
LINE | SCATTER |
Specify either LINE or
SCATTER. Specify two variables to plot that must both be numeric. The first variable is the X variable and values go across the plot; the second variable is the Y variable and values go up the plot. |
FILENAME
|
Specify the filename
produced by the procedure. If no filename is specified, the output is written to the default filename sirplot.srg. |
BOOLEAN
| Specifies which procedure table records are used by the procedure. The procedure table records for which the logical expression is true are used by the procedure. If this option is not specified, all procedure table records are used. |
SAMPLE
|
Specifies that a random sample of the procedure table records are
used by the procedure. The fraction specifies the percent of records used and is specified as a positive decimal number less than or equal to 1 (one). .25, for example specifies that a 25% sample be used. |
TITLE
|
Specifies the main title displayed at the top of the plot. Enclose the
text in quotes. If TITLE is omitted, the title is the names of the two variables. |
XTITLE
| Specifies a title for the x-axis displayed at the bottom of the plot. There is no default. |
YTITLE
| Specifies a title for the y-axis displayed vertically up the left axis of the plot. There is no default. |
RETRIEVAL
. INTEGER*4 AGE
. PROCESS CASES
. PROCESS REC 1
. COMPUTE AGE = (TODAY(0) - BIRTHDAY)/365
. MOVE VAR SALARY GENDER
. PERFORM PROCS
. END PROCESS REC
. END PROCESS CASES
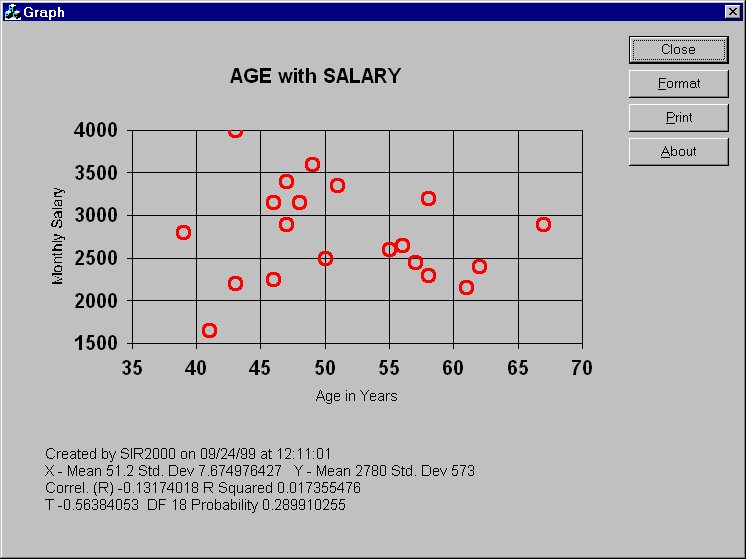
PLOT SCATTER = AGE, SALARY /
FILENAME = PLOT1.srg /
XTITLE = 'Age in Years'/
YTITLE = 'Monthly Salary'/
END RETRIEVAL
On completion of the program, the file PLOT1.SRG contains text which can be viewed with
ESCAPE 'sirgraph.exe plot1.srg'which looks something like:
| |